Musa Rotimi
Data Analyst and Business Metrics Specialist skilled in SQL, Excel, and Tableau


Thanks!
I appreciate you taking the time to visit my portfolio.
© All rights reserved.
Predicting bank loan approval with Logistic Regression for Binary Classification in Excel
The bank loan approval data set consists of 5001 rows of data including the header row and 14 columns. Here's the link to the data set gotten from Kaggle ;
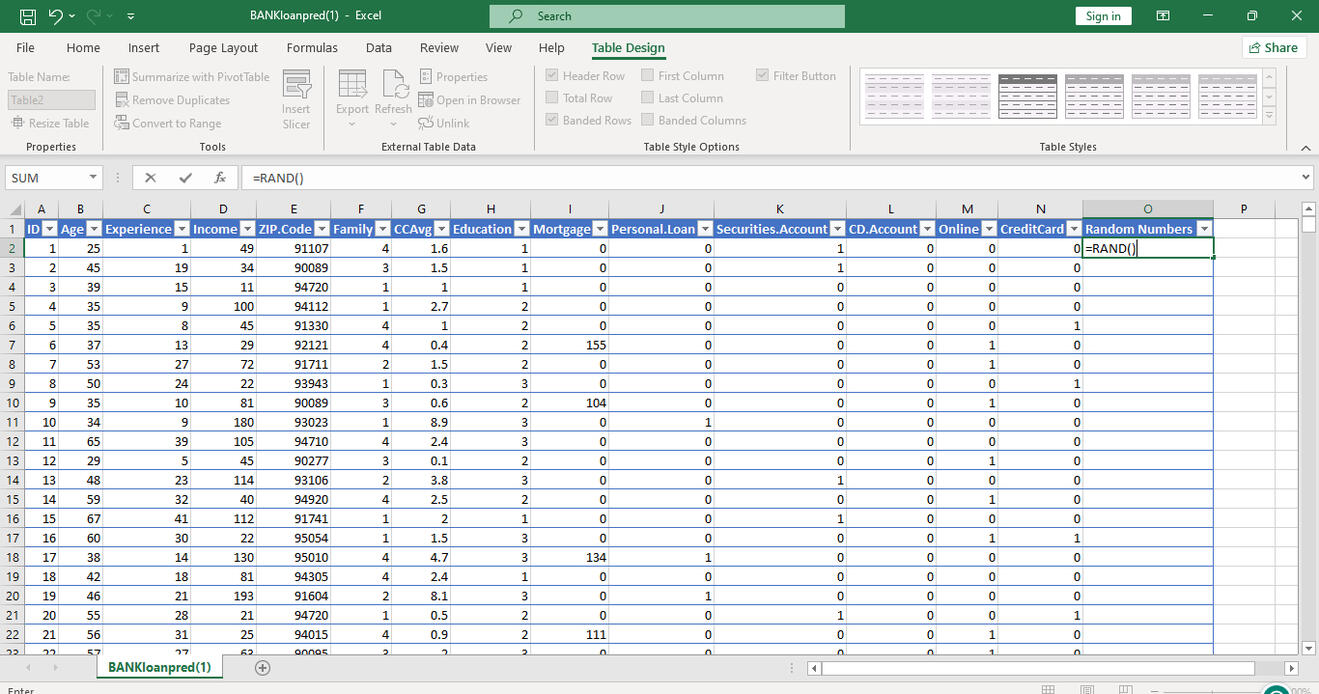
The data set is downloaded into Excel. The target variable is the "Personal Loan" column. A random number column is added to generate random numbers. The entire table is then formatted as a table and sorted in descending order using the random number column. This is done to randomly split the data set into 2; a Training set, and a Test set.
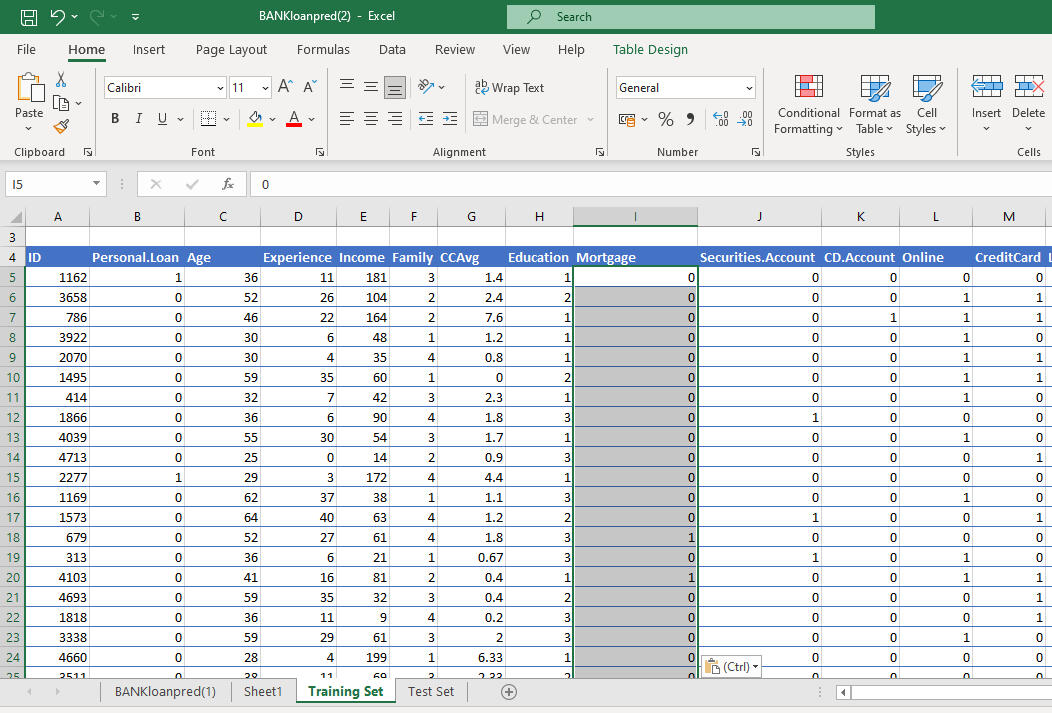
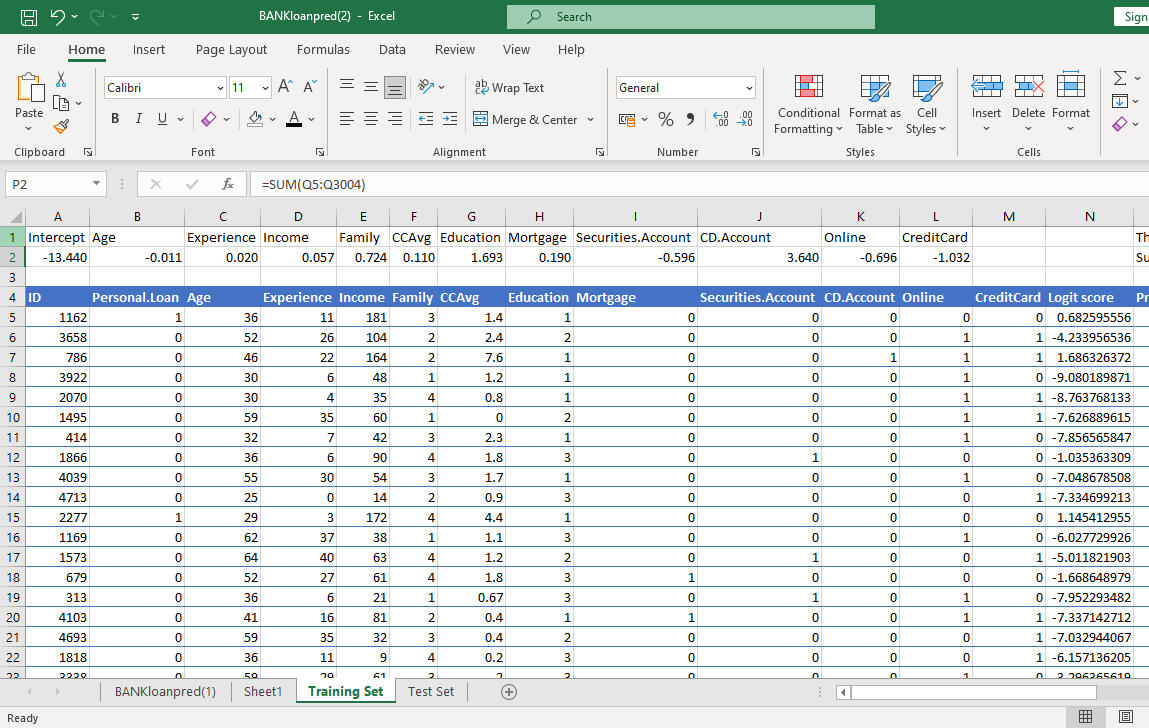
60% of the data, which is; 3000 rows of data is used as the training set and the remaining 40% = 2000 rows is used as the test set. The mortgage variable is converted to a dummy variable with 1=mortgage and 0= no mortgage. The postal code column is removed as the numerical value isn't related to its weight.
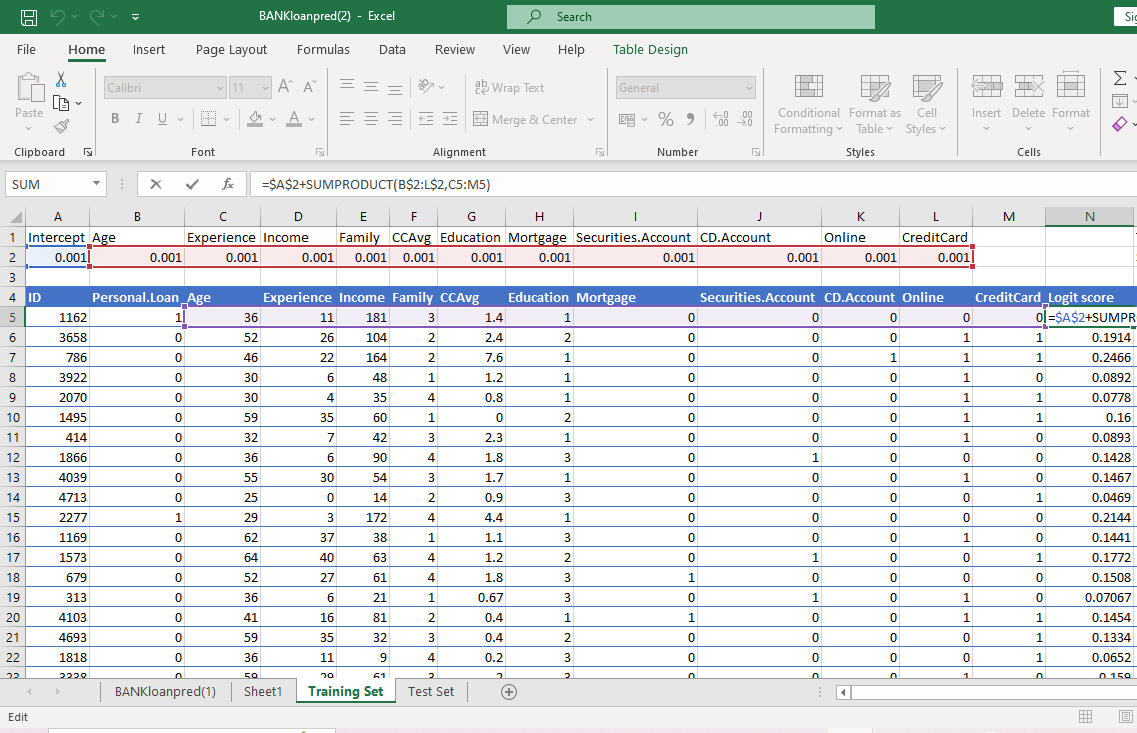
The logit score is calculated for each row using the variables multiplied by each of their randomly generated coefficients added to the intercept which would all be optimized later.
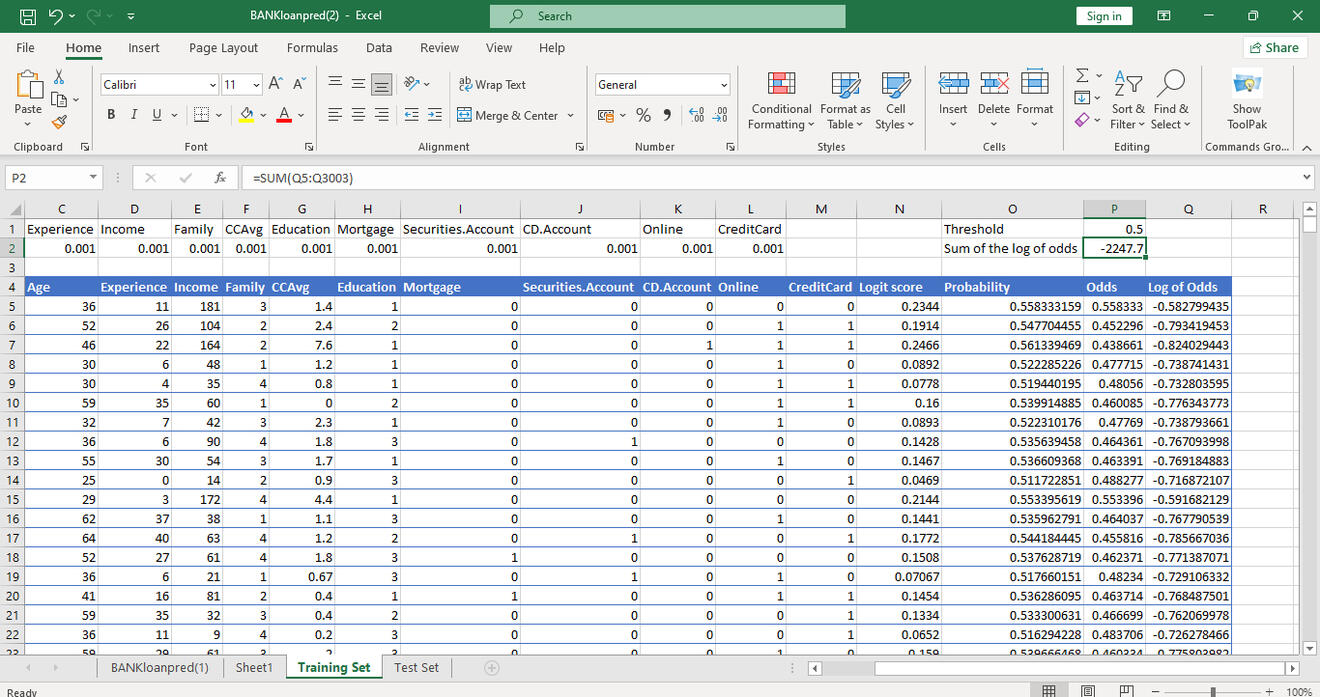
The probability, odds, and log of odds are calculated for each logit score and the sum of the log of odds is calculated at -2247.70, which is the number we will attempt to maximize to solve for the regression coefficients.
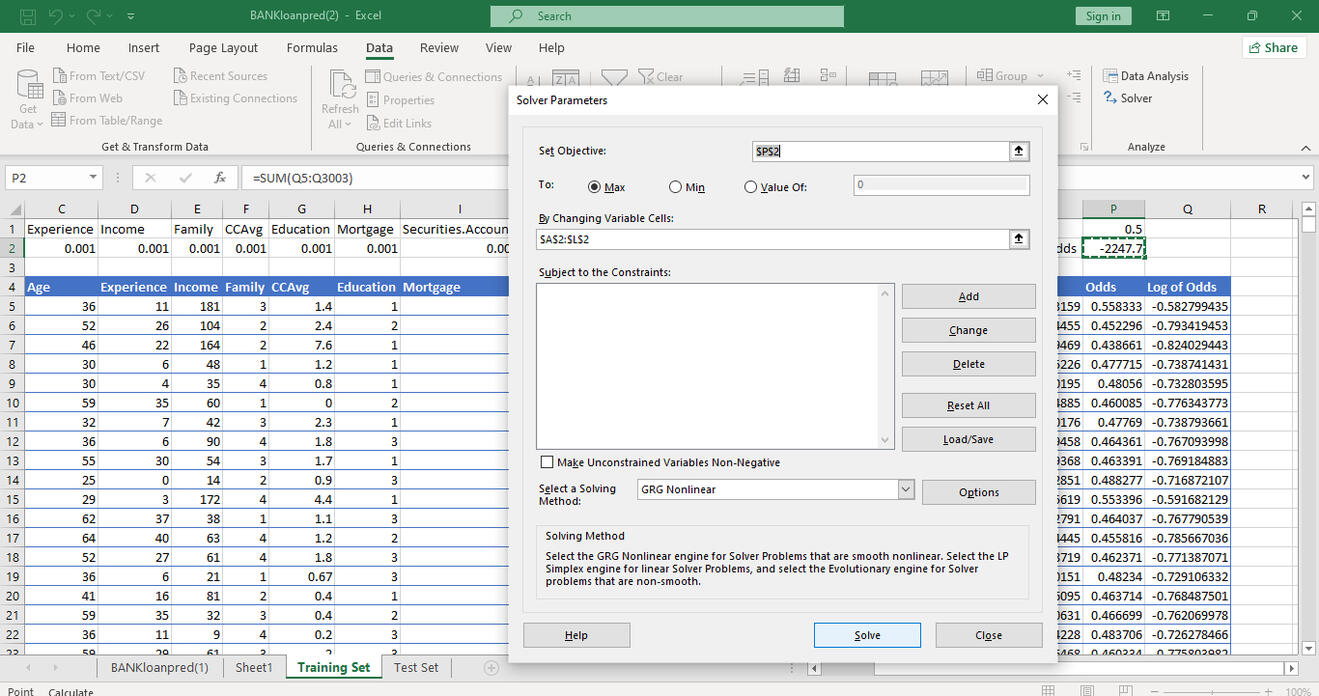
We leverage Solver on Excel to maximize the sum of the log of odds by changing the previously determined coefficients for the independent variables.
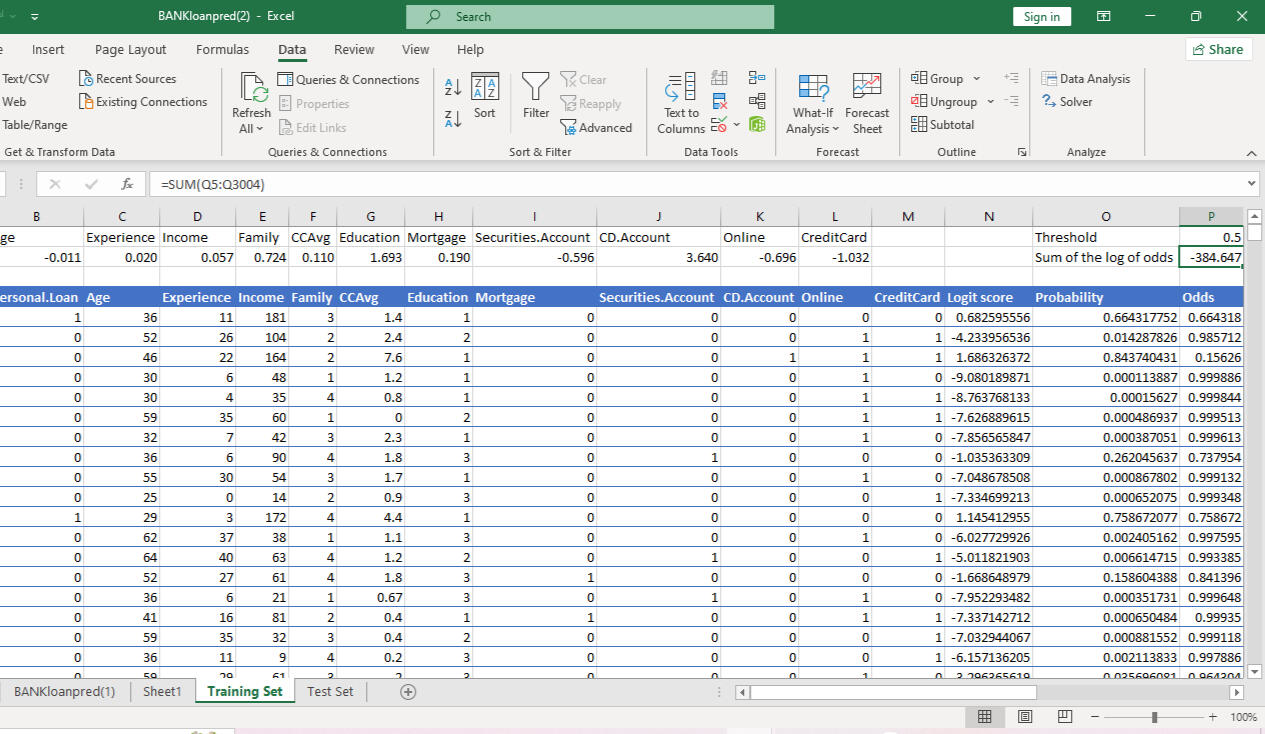
The sum of logs has been reduced to -384.647 by adjusting the coefficients of the independent variables. The coefficient of the experience variable being 0.02 means that 1 unit change, that is; a 1yr change in experience, while other independent variables are at the same level, produces 0.02 unit change in the log of the odd. We will get the odd value if we take exponential for log odd.
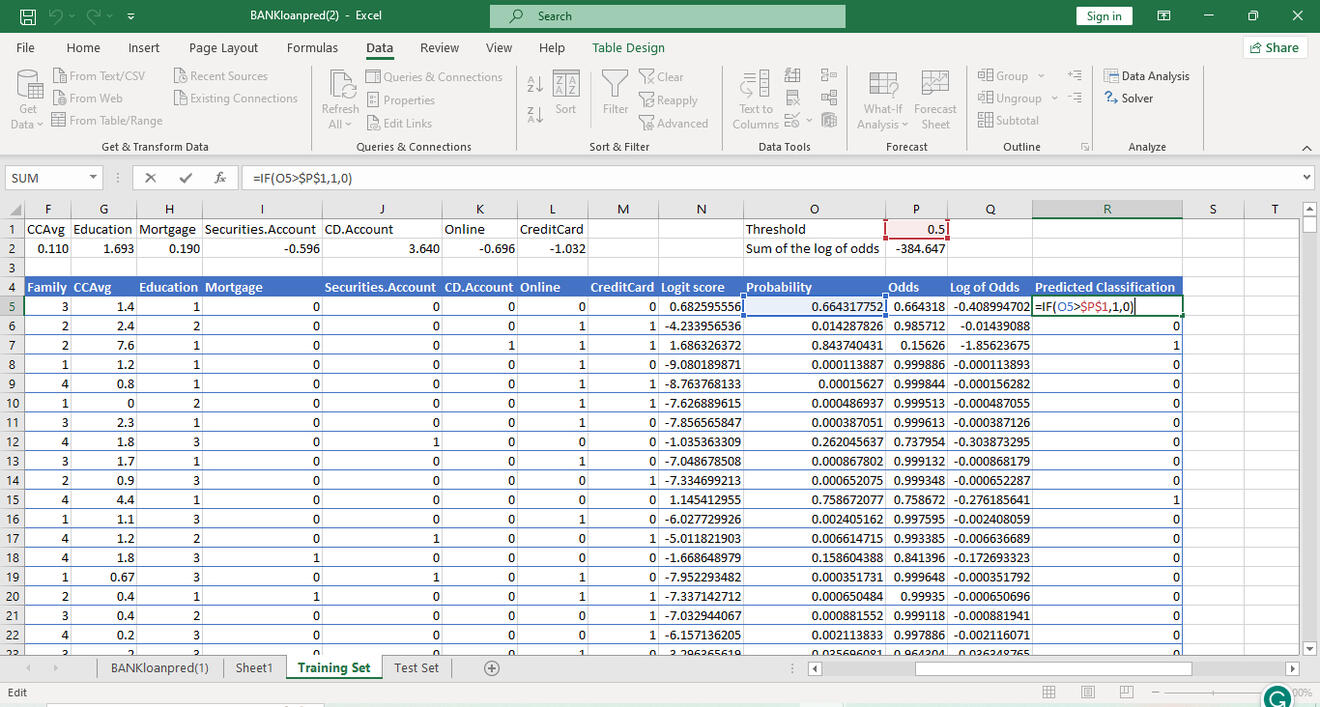
The threshold is set at 0.5, and every probability value above the threshold is classified as a success, 1 and every one below is classified as 0.
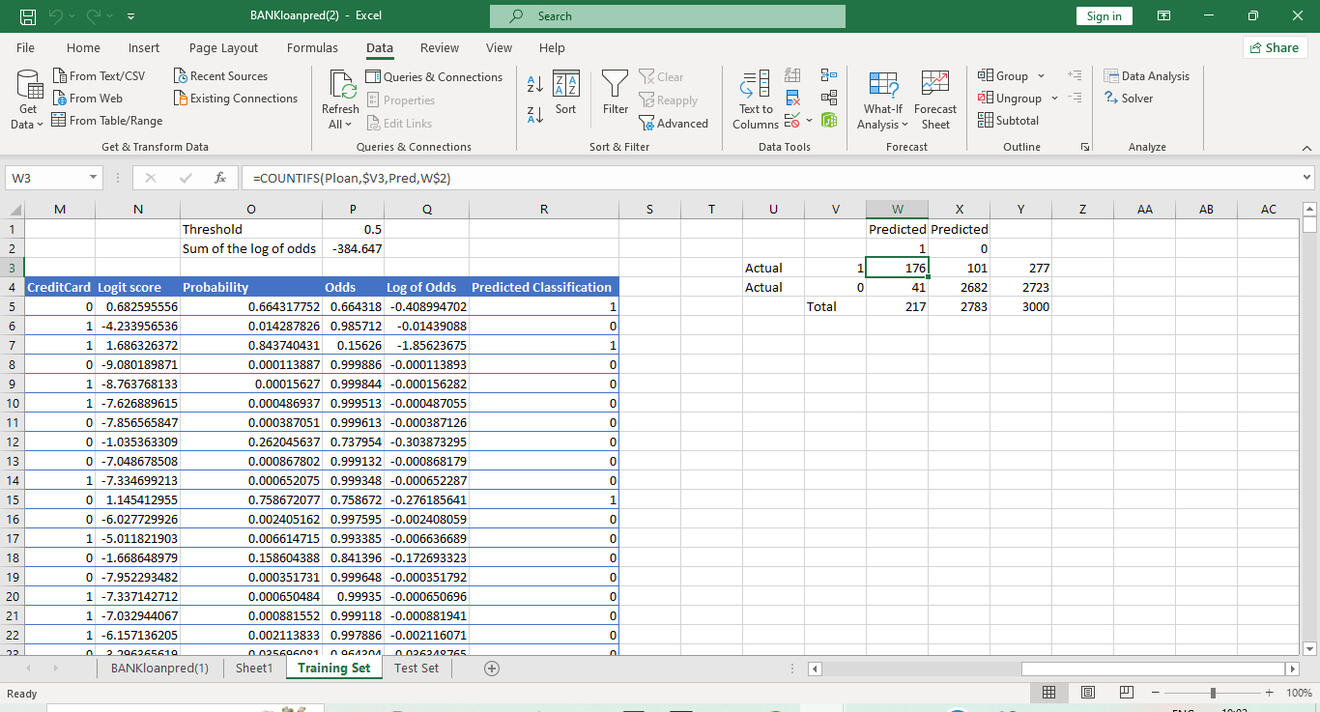
A confusion matrix is created to assess how effective the model is. We have 176 True Positives, 101 False Negatives, 41 False Positives, and 2682 True Negatives.
We also find ;
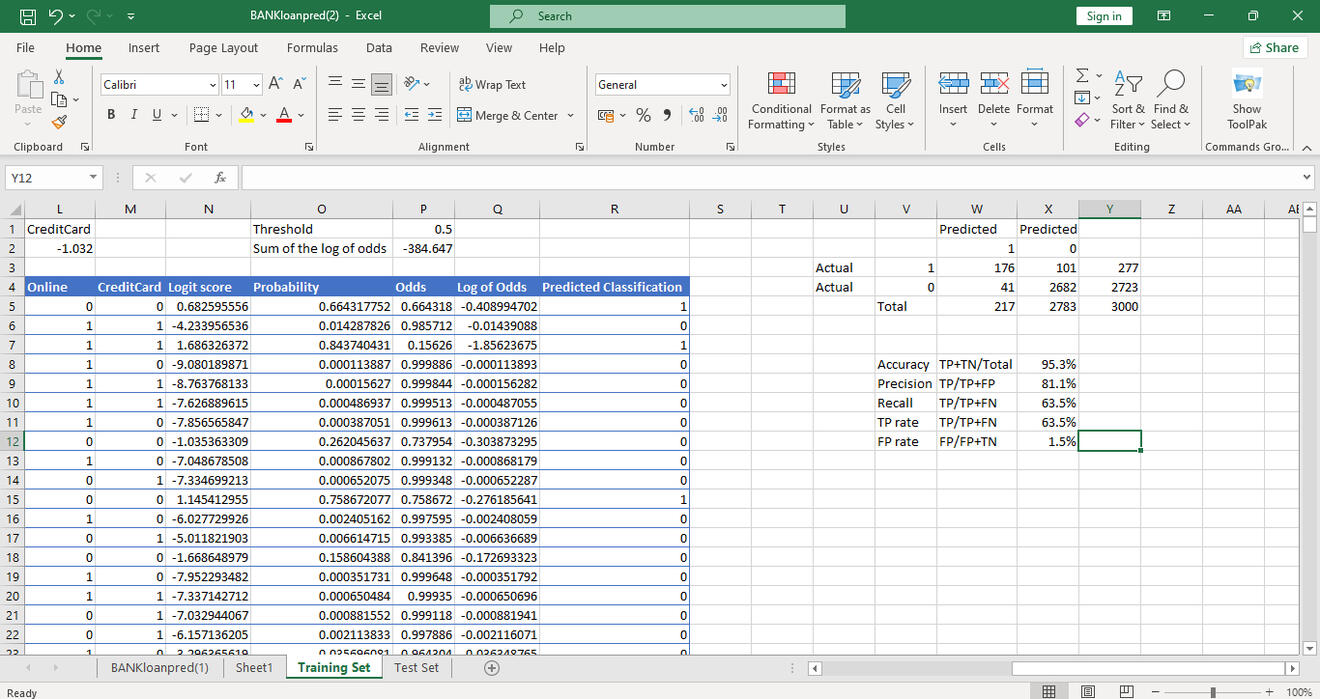
Accuracy: out of all observations, how many have we predicted correctly? The model shows 95.3% Accuracy.
Precision: out of the all cases predicted positive, how many are positive? The model shows 81.1% Precision.
Recall/Sensitivity/True Positive Rate: out of all actual positive cases, how many did we predict correctly? The model shows 63.5% Sensitivity.
False Positive Rate: out of all negative cases how many were wrongly predicted positive? The model shows a 1.5% False Positive Rate.
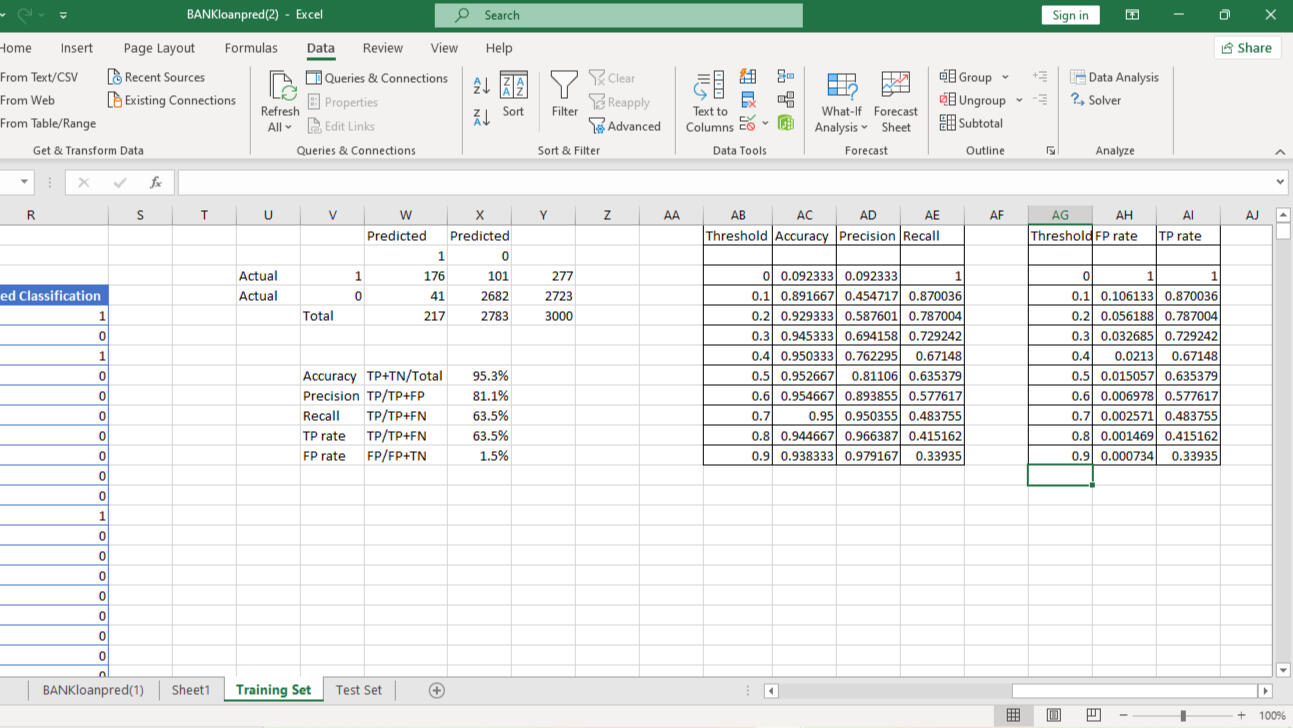
We leverage the What-If- Analysis to find what the Accuracy, Precision, Recall, and True positive rate would be at different thresholds. From the table, we notice as precision increases, recall decreases, and vice-versa. This is done to pick a threshold that supports our priority and the cost we're willing to bear.
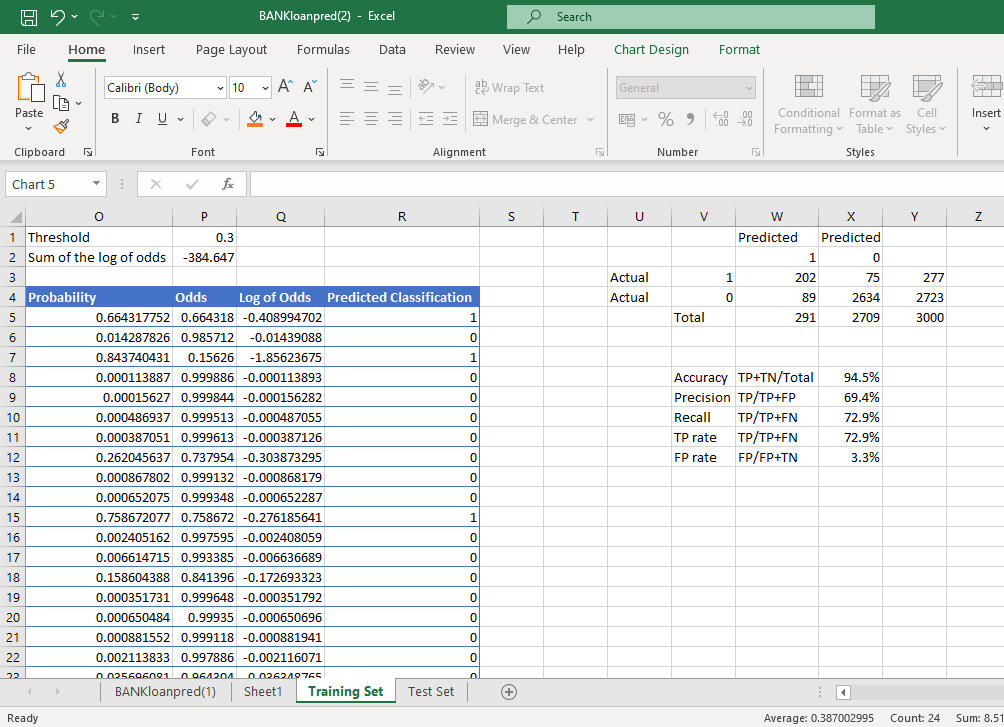
Since we're trying to predict correctly who the bank gives loans to and who isn't given. Recall is prioritized and the threshold is set at 0.3. Out of 277 approved bank loans we correctly predicted 202 with a recall of 72.9%, and of the 2723 not approved we correctly predicted 2634.
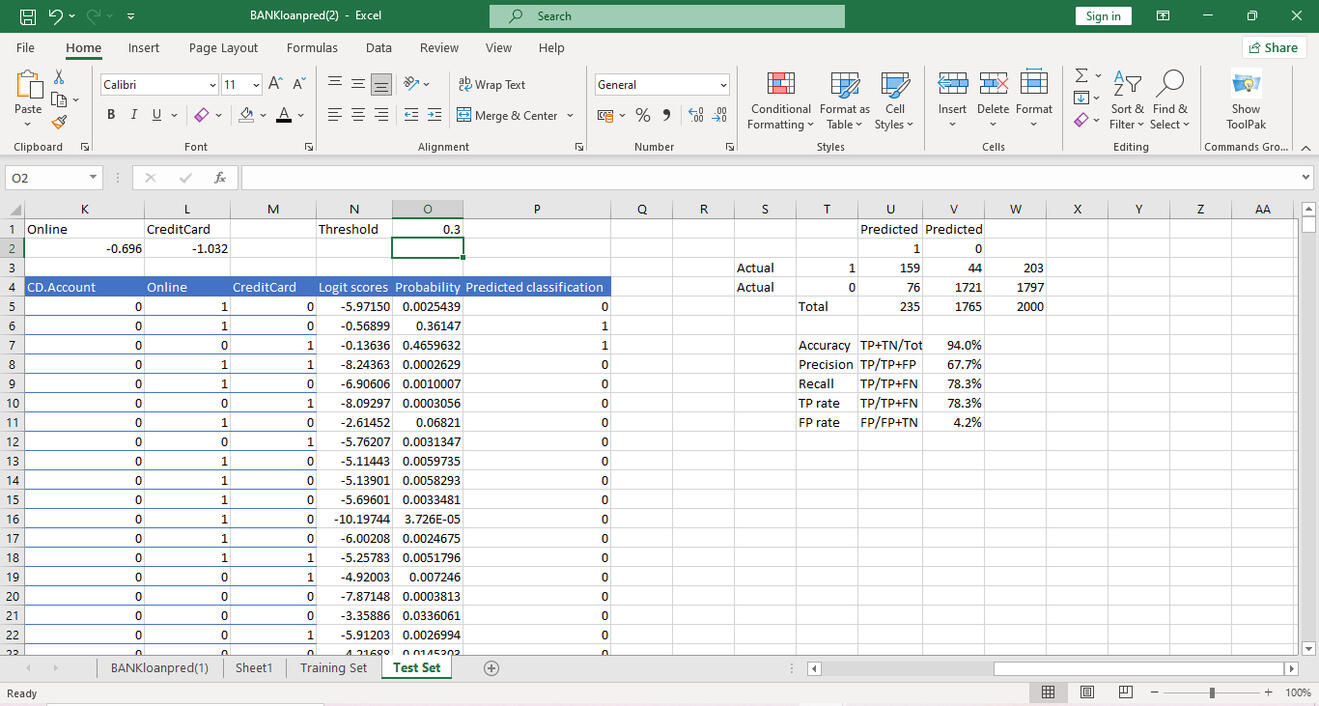
Using the same model, we apply it to the test set. Out of 203 bank loan approvals, we correctly predicted 159 with a recall of 78.3%., and of the 1797 not approved we correctly predicted 1721.
For new customers, you can apply the model to calculate their logit score and get the probability of them getting an approved loan from the bank.